Creating your charts could be a tricky and quite difficult activity. But, if you have a great program at your disposal, your job will instantly become easier. The lines that are to come will reveal you the advantages of using FusionCharts, which is definitely a delightful program for your web and mobile applications. Anyway, since this tool is appreciated in more than 100 countries by more than 20,000 customers and 450, 000 developers, you will love its features, too.
To begin with, something that will really make you happy is the fact that these javascript charts will work on all devices, browsers and platforms. To be more precise, it doesn’t really matter what you are using. Thus, you may have a PC, a Mac, an iPhone or an Android device, FusionCharts Suite XT will work beautifully.
Also, its rich interactivity will definitely please the users. And it is only natural since this tool is equipped with great tooltips, easy drill down, easy zooming and scrolling, clickable legend keys and the list may continue. Oh and one should definitely mention the fact that it also has jQuery charts. In short, people should become aware of the fact that if they are using this program they will have at their disposal a modern application that will provide them with really great charts.
Everybody knows that people are interested in programs that will allow them to save their time. Well, this is one of those programs. In fact, it will only take you 15 minutes to have your charts ready. You will receive a lot of help from their ready to use demos and their extensive documents. Also, their copy paste installation will make things a lot easier for you. After you have succeeded in setting up your demos, you will easily add drill down, chart exports, zooming, and so on.
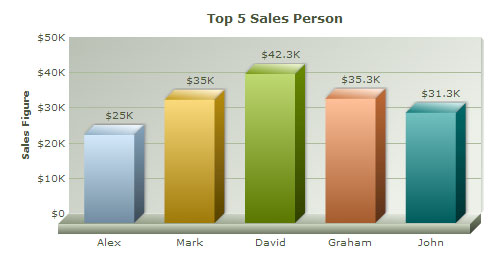
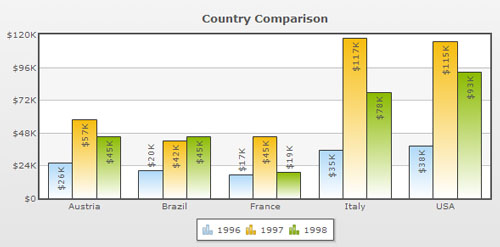
Moving on, another reason why people should go for FusionCharts Suite XT is due to the fact that it has the most comprehensive charting library. This means that they have over 90 chart types, from the most basic ones, like Column, Line and Pie to the most advanced, such as: Funnel, Pyramid and Pareto. Besides, there are over 900 maps of continents, countries and all US states, in case you need geographical data.
And, in case things get too difficult for you to handle, then you should know that they have a great support team. To be more precise there are: some self-support options, like documentation, knowledge base and a great forum which is available 24×7. But, if you need personalized support, then their tech support team will get you all the help you require, by purchasing their priority support and upgrades subscription.
So, if you are pleased with this information you could either purchase a personal use license or a license for corporate websites or intranet apps. However, you shouldn’t rush when making this decision. First of all you may download their free trial and see if their features suit your business.


